

Printable Base89 LUT Encoding
Mon 20 October 2025
Michael Labbe
#code
Need
In state logic or semantic markup with text strings, there are two options: in-band formatting, or out of band formatting.
In-band formatting indicates changes in a string. For instance:
Hello <span name="first_name">Fred</span>Out-of-band markup involves describing a range of characters as having properties as part of a separate data structure.
const char *text = "Hello Fred";Span spans[] = { {6, 10, "first_name"} // chars 6-9 form "Fred"};Out-of-band markup is ultimately more efficient, but in-band markup has the advantage of being incredibly handy to author in an ad-hoc way, such as when putting together a string literal in a program.
Unfortunately, all of the in-band markup languages are intended for a specific output environment, such as ANSI escape sequences or HTML, and the definitions of them are large, but also limited to the intended use of the defining parties.
Printable Base89 LUT Encoding addresses this. You embed indices into a lookup table in your string. What is in the lookup table is up to you, the developer.
The following spec only describes how to embed the lookup table indices in a string, not what you could do with it. In practice it is useful for a few things:
-
Semantic markup for theming
-
Styled output that can be emitted to in-game text rendering, console or a browser including font swapping, kinetic type styling and rendering transforms
-
Denoting positional arguments for localization
It’s just an index into your lookup table. You decide.
Introduction
Printable Base89 LUT encoding is used to embed indices into UTF-8 encoded strings. The lookup table’s use is left up to the user.
Printable Base89 LUT encoded control codes have the following properties:
-
The purpose of each index is ascribed by the developer, not the encoding designer
-
Embeddable in UTF-8 encoded strings
-
Viable for systems dev: All control codes display correctly in Visual Studio, gdb, and in terminals
-
Viable for web dev: All control codes log correctly in browsers
-
Trivially skippable: Constant 4-byte length, unlike ANSI/VT codes
-
Specification includes error handling behaviours
-
Compatible by design with C preprocessor concatenation
Control Code
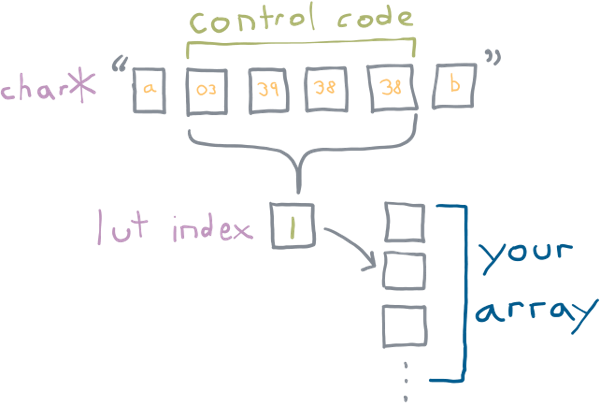
A Printable Base89 LUT control code has the following byte sequence:
ST C1 C2 C303 xx xx xx^ ^ ^| | || LSB MSB|constantxx is a value between [38, 126]. C1 through C3 contain values
that combine to produce an index into a lookup table. C1 is the
LSB, C3 is the MSB.
C1 through C3 all base89 packed integers. They can have a value
between 38 and 126 (inclusive), for a total of 89 possible values.
Why these values? The strings must be printable in any debugger, or dumped to a terminal without being interpreted in a manner that makes review difficult or impossible. The range 38 to 126 are all normal printable single byte UTF-8 characters. In fact, 126 is the last normal, printable character.
But why 38 for a starting value? 37 is the ordinal number of %, which would need to be
escaped if inserted into a C format specifier string. When avoided, we
have a range of 89 possible values per byte.
The three values are combined, with C3 being the MSB.
This forms an index that can be used to lookup into a table which is:
index = (C3 - 38) * 89^2 + (C2 - 38) * 89 + (C1 - 38)The maximum value is calculated as:
max_index = (88 * 89^2) + (88 * 89) + 88 = 704,968The base-10 byte pattern of the maximum value is:
ST C1 C2 C303 126 126 126the base-10 minimum value is:
ST C1 C2 C303 38 38 38The following caveats exist in correct processing of these codes:
-
Index 0 is reserved to indicate an error condition during unpacking. If a code is malformed, index 0 is returned. Make the 0th index in your LUT handle errors.
-
any byte value in
C1-C3outside of the range[38,126]results in an index of 0 — error condition. String processing continues after the sequence. -
If a Printable Base89 LUT code truncates (string does not have three bytes remaining after ST), the index returned is 0 — error condition. String processing terminates, but the part of the string before the truncated Base89 LUT code is still valid.
-
The resulting index can be between 0 and 704968, but oftentimes the lookup will be much smaller. If the index is out of range for a LUT, return index 0 — error condition. Continue string processing.
-
There is no explicit support for escaping ST, eg. having
0x03
    0x03
in a string to produce a single0x03by a string processor. If verbatim0x03is needed in a string for any reason, use a LUT index to emit it. -
If control codes are not legal inside a part of a string (such as inside quotes), the string processor must handle this according to your quote processing needs.
-
Encoding an out-of-range index is a runtime error to be handled appropriately. Do not silently encode 0.
Example Use For Semantic Markup
It is straightforward to define a Printable Base89 LUT code as a string in C and use it in a preprocessor concatenation:
// note: \x27 is 0x27 which is 39 in base 10#define CODE_RESET "\x03\x27\x26\x26"#define CODE_NAME "\x03\x28\x26\x26"#define NAME(x) CODE_NAME x CODE_RESETconst char str[] = "Hello, " NAME("guy");static const char* ANSI_LUT[] = { // index 0 is always error "ERROR", // reset "\x1b[0m", // name - bold "\x1b[1m",};static const char* HTML_LUT[] = { // index 0 is always error "<ERROR>", // reset "</span>", // name "<span class='name'>",};output_ansi_string(str);output_html_string(str); Admonishment: Security
Exotic use leads to security issues.
Having the ability to look up into a table and perform arbitrary processing while scanning strings will inevitably lead to exotic uses and therefore security abuses.
The functions that actually process strings rarely have the ability to determine whether the string has user input in it. The reality is that everything that manipulates up the stack needs to correctly anticipate what an LUT can do to the whole system state. Because a LUT gets added to during development, managing what processing a user can do to the system at the place in the code where the string is assembled becomes intractable. Do not do unmanageably crazy things in your table logic.
FAQ
Why continue string processing after an error was encountered?
Efficient string processing routines intended for output emit pieces of a string to buffered streams as needed. Doing string processing of arbitrary length likely requires an allocation, and an additional buffer, in addition to what the buffered stream is doing.
A reasonably efficient Printable Base89 LUT string processor scans a string until an ST code is reached, emits the string up until that point, processes the code, and then continues to scan. This is preferred to copying the string into a buffer and emitting it all at once.
Is it possible to directly encode index 0?
LUT index 0 is reserved for the error case. You should not use it for
a normal sequence. It is possible to encode index zero using the sequence 0x03 0x26 0x26 0x26 in your string, though there is no
reason to do so.
This is preferred to adding one to the processed code, which just adds complexity.
What happens if untrusted input contains a control code?
All untrusted input needs to scan for the ST 0x03 byte, and have it
validated or removed.
This is nothing new. ANSI escape sequences in untrusted user input can also affect output, and need to be validated or removed.
If I Implement This, Where Should I Link to the Spec?
This article’s slug is the permalink you are looking for.
Links To Implementations
-
C single header file: ftg_base89.h
-
Python module py-base89lut
Software Adoption Revolutions Come from Architectural Shifts, Not Performance Bumps
Tue 30 September 2025
Michael Labbe
#code
Choosing what to work on is one of the most interesting parts of building software. As developers, we often see tooling with suboptimal efficiency and aspire to rewrite it. In many cases, the performance gains can be substantial — but historically it has been user productivity gains that drive adoption in the large, not simply execution performance.
When looking at the history of software adoption revolutions, the productivity of the user was the dominating factor in making significant, sweeping changes to how we develop. Execution time, exclusive of other improvements, is commonly not sufficient to increase productivity enough to produce a large-scale software adoption revolution.
The more impactful thing we can do in designing software is to rethink the solution to the problem from first principles.
Key examples in the history of software that shaped current usage at large:
-
Interactive time-sharing terminals replaced batch-processed punch cards, giving a 10x increase in the number of feedback cycles in a day. Faster punch card processing would not have competed with this shift.
-
Software purchased and updated online: more stores and efficient disc storage could not win over the high convenience of automated bit synchronization afforded by platforms like Steam.
-
Owning server racks versus on-demand cloud: In many cases, developers traded provisioning time and cost for execution time and cost. This enabled a generation of developers to explore a business problem space without making a capital-intensive commitment to purchase server hardware upfront.
-
Virtualization: Isolated kernel driver testing, sandboxed bug reproduction, and hardware simulation greatly reduced the provisioning time necessary to reproduce system bugs. This underpins the explosion in kernel fuzzing and systems continuous integration (CI). Faster computers alone would not have delivered the same productivity multiplier.
-
Live linked game assets: Artists get real-time feedback when they make geometry changes to assets in modelling tools. While optimized exporters and importers are still important, this alone could not result in the productivity multiplier that comes from real-time feedback.
-
Declarative, immutable runtimes: Docker vastly reduced environment setup time. Consequently, this massively reduced guesswork as to whether a bug was isolated to a mutable execution environment. Highly optimized test environment provisioning would not have produced these productivity gains at the same scale.
Some of these productivity improvements, unfortunately, came with performance regressions. And yet, the software adoption revolutions occurred nonetheless.
Much of the software we use could benefit from being significantly faster. Reimplementing that software for better performance is like running farther in the same direction. Rearchitecting the software is like running in an entirely different direction. You should go as far as you can in the best direction.
We should write performant software because computing should be enjoyable, because slow software inefficiencies add up, and because high performance software is a competitive edge. The first step, however, is to consider how best to solve the problem. Performance improvements alone may not be deeply persuasive to large groups of users seeking productivity.
Human-computer Experiences are Thresholded, Not Linear
Thu 29 May 2025
Michael Labbe
#product
Many human-computer experiences are based on qualities that are challenging to achieve: cool, light, fast to boot, responsive. It is important to know when to invest in optimizations that deliver these results in meaningful quantities, and when to choose other priorities.
Common knowledge presumes that these qualities improve experiences linearly, but to put it simply: they do not. Human-computer interactions have soft thresholds that map to limits within human physiology. In some human-computer interactions, there are laws such as Fitts’s Law, derived from experimental studies that back an important intuition: thresholds exist in human perception and motor performance.
This has numerous implications for where optimizing engineers should prioritize time on a computer product to achieve the best human experiences and define the product’s position in the marketplace.
I am going to suggest some time durations as I lay out these implications. These are based on my own intuition and experience.
-
Compile times that exceed roughly 20 seconds prompt the programmer to do something else like read Reddit. This evicts your working memory and results in an absolute productivity cliff.
- Baddeley & Hitch (1974): Working Memory as an Active Model
-
Framerate and input responsiveness in FPS aiming: related to Fitts’s Law for pointing in two dimensions — aiming benefits from higher framerates. Each multiple of 30 up to 120 has benefits, with 60 being a greatly impactful improvement over 30, but 120 being not much better than 90 fps.
- NVIDIA: Latency of 30 ms Benefits First Person Targeting Tasks More Than Refresh Rate Above 60 Hz: “We [also] show small but statistically significant improvement in performance of some tasks at higher [>60fps] refresh rates.”
-
Battery life: “all day” battery life (a guaranteed 8+ hours) means leaving the charger at home and not even needing to think about battery management during the day. An all-day battery may be 200g heavier, but would save a laptop user from carrying a 400g charger. For many users, only hitting seven hours means carrying a charger, whereas eight would not. This crosses a threshold.
-
Game content creation tool response times affect how much effort the user makes to achieve an intended result. For instance, perfecting environment lighting is a highly iterative process. How many iterations an author is willing to make appears to be bounded by response times:
- 10ms: 1,000 changes
- 100ms: 100 changes
- 1,000ms: 10 changes
- 10,000ms: 1 change
There are numerous examples with varying rigour, such as the 400 millisecond Doherty threshold, but I would encourage you to experience as much of these directly as you can. As this is a qualitative matter, lean on your own intuition and judgment to draw your own conclusions where possible.
Because human-computer experiences are thresholded, not all optimizations are valued the same. Ask yourself:
- What experiences am I close to surpassing a threshold on?
- What is the cost of the optimization that gets me past that threshold?
- What experiences am I far from surpassing a threshold on?
- Can I trade against the distant threshold to optimize in favour of the closer threshold?
You can cross a human-computer experience threshold by choosing which experience to optimize for, thereby building meaningful gains into your product. This can produce superlinear productivity gains, or even just plain enjoyment.